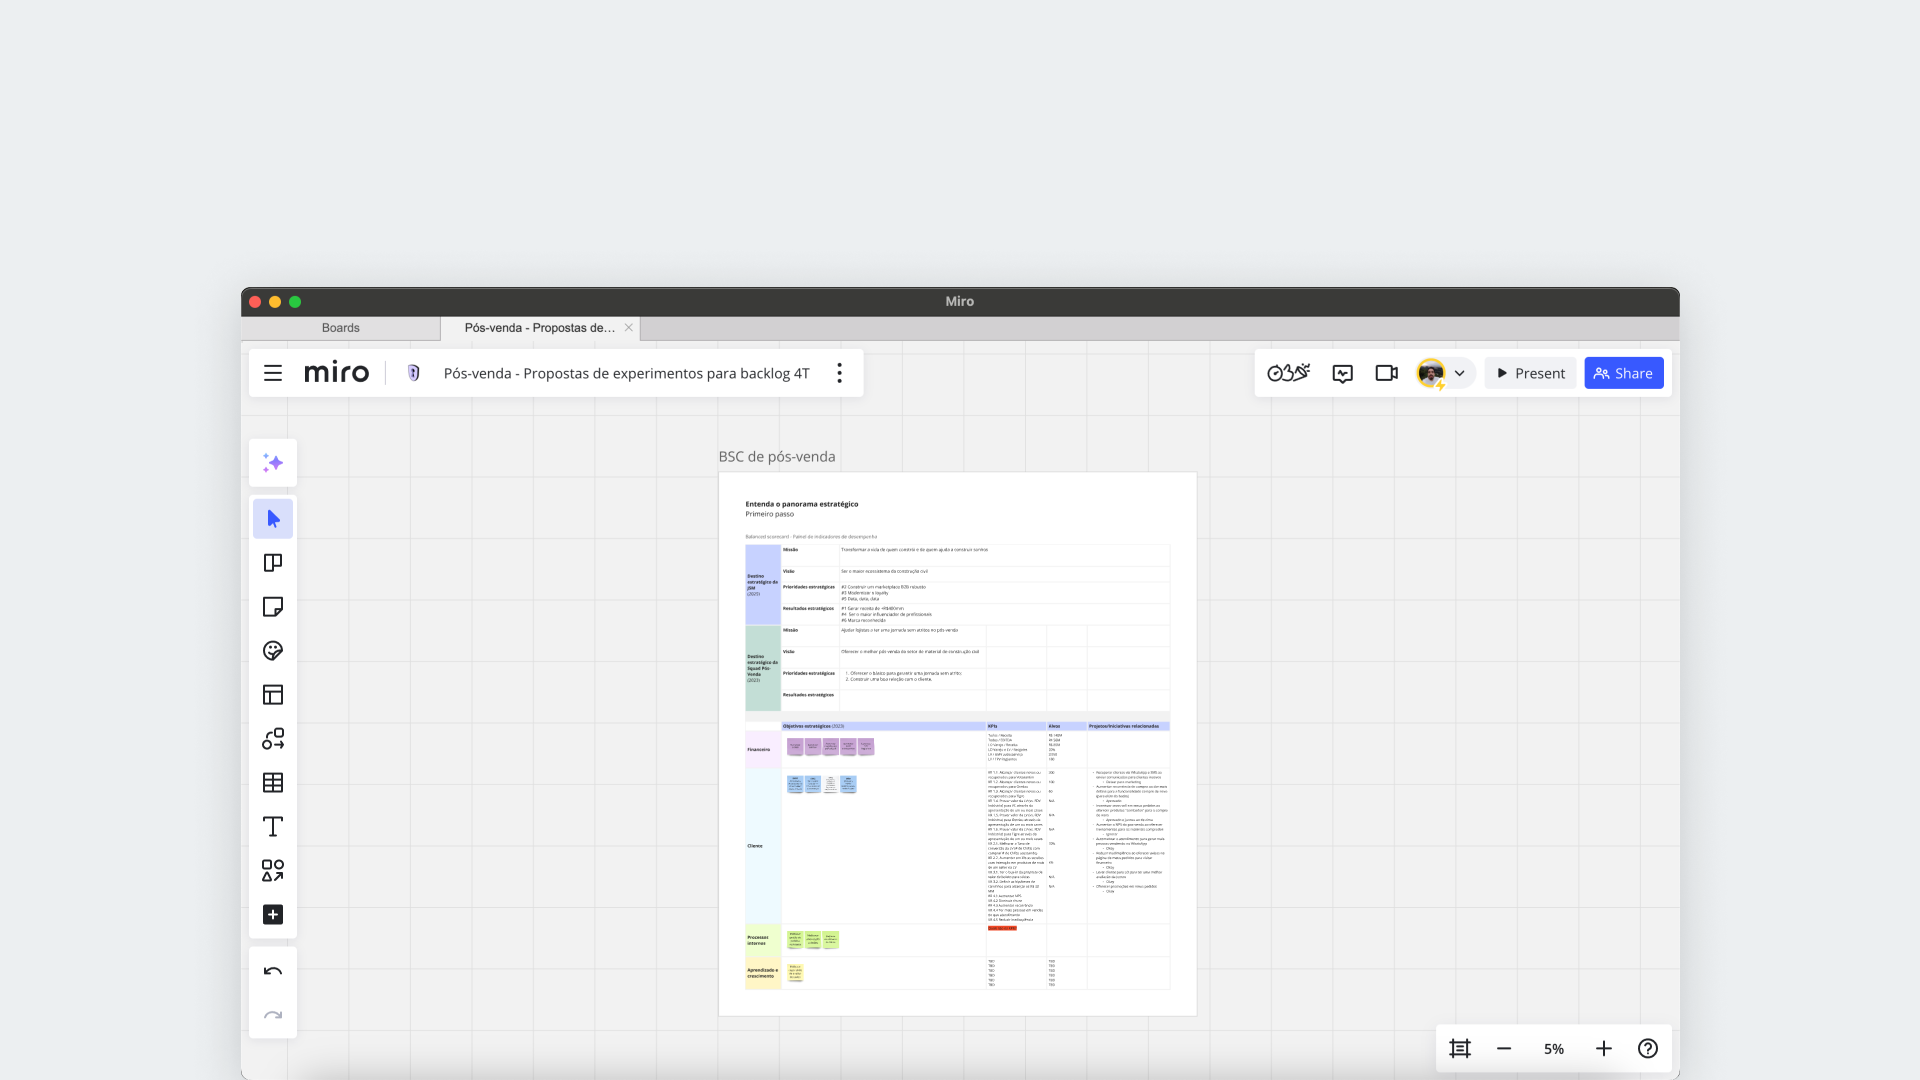
Chasing churn: post-sales metrics and triggers explored

Situation
The post-sales squad at Juntos Somos Mais faced two critical challenges: a lack of clear performance metrics and difficulty identifying the root causes of customer churn. Without this understanding, the team struggled to measure effectiveness, improve performance, or build targeted retention strategies.
Task
I led a research initiative to address these gaps with three core objectives:
- Discover real pain points in post-sales activities.
- Define actionable metrics to monitor and improve performance.
- Identify key churn triggers to guide retention strategies
- The overarching goal was to enable the post-sales team to focus on what truly impacts customers and reduce churn.
Action
I structured the research into three objectives, combining qualitative and quantitative methods:
- Research:
- Reviewed prior internal research on user pain points.
- Launched an NPS survey to quantify user frustrations.
- Began analyzing open tickets to identify recurring post-sales issues.
- Benchmarked common post-sales metrics from literature and aligned them with pain points.
- Designed churn data analysis plans, including reviewing ticket histories, subjects, and churn rates.
- Conducted discussions with consulting/support teams and initiated churned-user interviews.
- Ideation:
- Structured approach to prioritize metrics and align them with pain points.
- Planned a churn dashboard to visualize metrics and insights for decision-making.
- Design & Collaboration:
- Iteratively engaged users and internal teams to refine hypotheses.
- Translated qualitative insights into measurable indicators.
- Outlined a monitoring tool to consolidate insights and guide the team.
Result
The project is ongoing but has already delivered meaningful progress:
- Identified initial user pain points through surveys and ticket analysis.
- Prioritized critical post-sales metrics for monitoring performance.
- Early findings from team discussions and churned-user feedback are shedding light on churn drivers.
Although still in progress, the research created a strong foundation for post-sales improvements and churn reduction.
Reflection and learnings
- Aligning pain points with measurable metrics is complex but essential for long-term improvements.
- A phased, structured approach allows consistent progress despite data challenges.
- Collaboration with internal teams and users ensures nuanced understanding of churn triggers.
- Research-driven initiatives can generate value even before full implementation.
Future opportunities
- Complete open ticket analysis to uncover additional pain points.
- Build and launch a churn dashboard for real-time visibility of key metrics.
- Expand interviews with churned users to refine understanding of churn drivers.
- Translate insights into retention strategies and actionable improvements for the post-sales squad.